Describe the report you want and AI builds it
Turn a simple request into live dashboards from your CRM data, refine them in chat and publish them to your team.
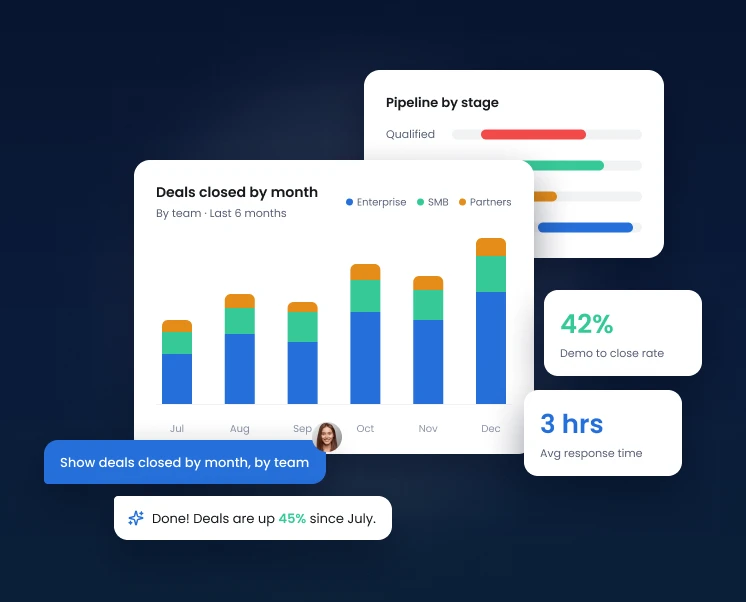
Ask a question. Get a dashboard.
One request, a full report
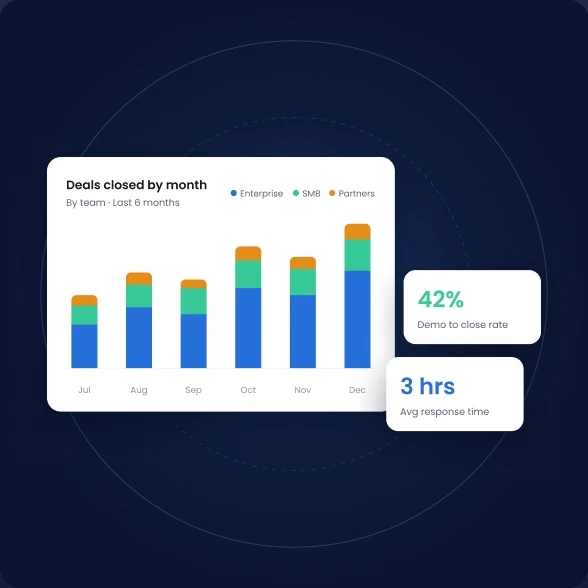
Ask for what you want to see. Data Studio picks the right metrics, charts and tables and builds them from your Fireberry data.
- KPI cards with targets and trends
- Line, bar and distribution charts
- Tables with the records behind the numbers
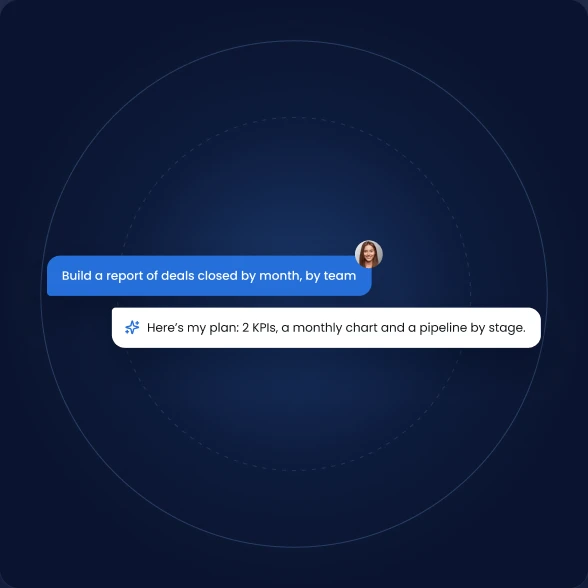
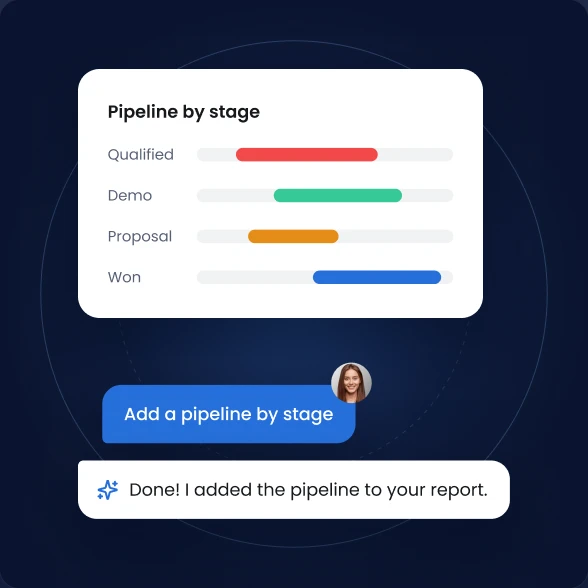
Refine in chat
Keep the conversation going to add a chart, change a metric or break down the results differently. The report updates as you go.
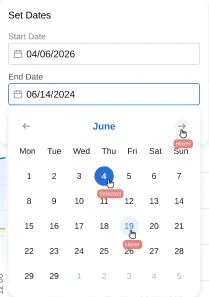
- Date ranges: today, 7, 14 or 30 days, all time or a custom range
- Filters your team can change themselves
- Duplicate a report to start a new one from it
Share with your team
Publish the report so the whole team sees the same live numbers. Export or print when you need a copy.
- Publish to your team
- Export and print
- Scheduled PDF delivery by email Coming soon
Reports teams ask for
Campaign performance
Leads, ROI and results by channel for the quarter.
Retention insights
Retention, segment breakdown and at-risk customers in one view.
Pipeline review
Conversion rate, deal value against target and growth by rep.
Data Studio FAQ
From the objects and records in your Fireberry account, so reports always show up-to-date numbers.
No. Describe what you want to see and Data Studio builds it. You can refine the report in conversation.
Yes. Publish it and your team can open it, change the date range and filter.
Scheduled PDF delivery is coming soon. Today you can export and print any report.